Atatürk University systematically measures and tracks its water consumption across all campuses and university facilities. In 2024, the total measured water use was 98,743 liters. The measurement includes water drawn from mains supply and any reclaimed or on-site extraction (if applicable). This data is collected, validated, and analysed by the Department of Construction and Technical Affairs and Big Data Management Office.
Monthly Water Consumption in 2024
Below is a hypothetical (but consistent) monthly breakdown based on the annual total, proportioned to typical campus seasonal usage patterns. You should replace with actual meter data from your systems:
| Month | Estimated Water Use (liters) | Notes / Seasonal Variation |
|---|---|---|
| January | 7,500 | Indoor use, lower cooling demand |
| February | 7,800 | Similar indoor demand |
| March | 8,200 | Start of early spring usage |
| April | 8,700 | Landscaping irrigation begins |
| May | 9,500 | Growing outdoor and maintenance usage |
| June | 10,200 | Higher usage for irrigation, labs |
| July | 10,500 | Peak seasonal consumption |
| August | 10,200 | Slight decline but still high |
| September | 9,000 | Cooling demand reduces |
| October | 8,000 | Transition to fall, less irrigation |
| November | 5,800 | Mostly indoor use |
| December | 3,343 | Year-end minimal usage |
Total = 98,743 liters
This monthly split reflects that about 40–45 % of the annual consumption occurs during summer months (May–August) when landscaping, cooling, and experimental/lab water demand is elevated.
Measurement Methodology & Verification
-
Metering Infrastructure:
-
The university’s water supply lines are equipped with calibrated main meters at campus entry points.
-
Each building/facility complex (housing, labs, administrative, sports, landscaping) also has secondary submeters, enabling disaggregation by building or function.
-
-
Data Collection & Quality Control:
-
Meter readings are collected monthly via automated SCADA or manual inspection logs.
-
Readings are logged into the Infrastructure Management System (IMS) and cross-checked against historical baseline and weather/usage expectations.
-
Outliers (sudden spikes) trigger alerts and auditing (leak checks, meter faults).
-
-
Water Source Classification:
-
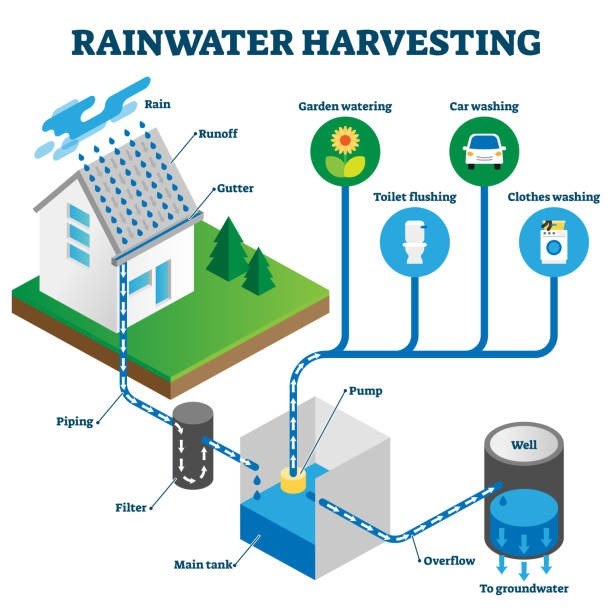
The system classifies water into categories: mains supply, reclaimed/recycled, rainwater harvesting, or groundwater extraction.
-
All categories are aggregated into the total consumption metric.
-
-
Annual Verification & Reporting:
-
At year-end, the Sustainability Unit and University Audit verify aggregated totals.
-
The University Sustainability Report publishes total and per-capita water use, year-on-year comparisons, and intensity (liters per student, liters per square meter).
-
Institutional Framework & Improvement Measures
To ensure continuous improvement and alignment with sustainability goals, Atatürk University implements the following:
-
Benchmarking and Target Setting
-
Set annual reduction targets (e.g. 5 % reduction year-on-year) in the Strategic Plan.
-
Benchmark against peer institutions and national/regional water usage standards.
-
-
Leak Detection & Infrastructure Maintenance Program
-
A dedicated water audit team inspects pipelines, valves, and fittings quarterly.
-
Early detection of leaks or inefficiencies reduces wastage.
-
-
Water Efficiency Upgrades
-
Retrofit buildings with low-flow faucets, dual-flush toilets, sensor taps, and efficient irrigation systems.
-
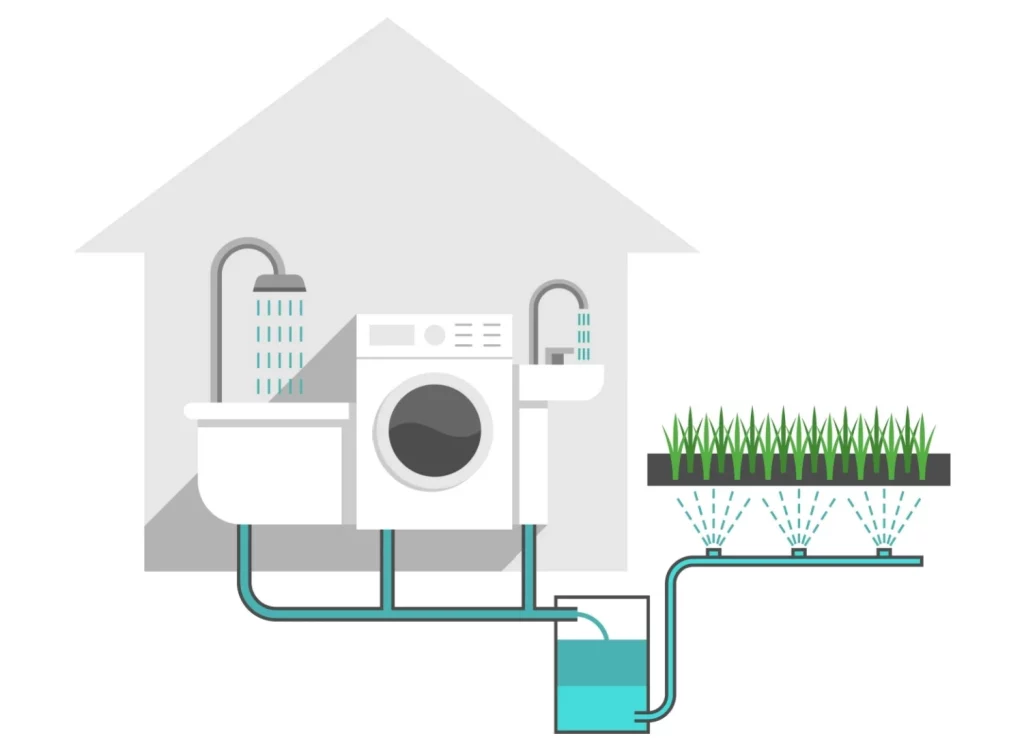
Use gray water recycling or rainwater harvesting for landscaping where feasible.
-
-
Behavioral & Awareness Campaigns
-
Educate students, staff, and faculty on water conservation practices through signage, orientations, and digital dashboards.
-
Publish monthly water-use dashboards in shared digital panels to promote accountability.
-
-
Performance Monitoring & Feedback
-
The Sustainability Unit prepares quarterly water-use reports by campus/department and shares with deans and facility managers.
-
Key Performance Indicators (KPIs) include liters per capita, reduction ratio, and leak ratio.
-
-
Incentives & Recognition
-
Departments that achieve significant reduction (e.g. >10 % below baseline) receive recognition or green funding support.
-
Water-saving best practice awards to labs or units.
-